PJM Electricity Prices Are Rewriting Industrial Budgets: Why Understanding Your Bill Comes Before Fixing It
PJM capacity prices rose 1,038% in two years and the 2028/29 auction fell 6,831 MW short. What to verify on your bill before changing suppliers.
Updated
PJM capacity is no longer a rounding error. It is now a primary explanation for why industrial electricity budgets are increasing across Pennsylvania, Ohio, Illinois, New Jersey, Indiana, Virginia, Maryland, and other PJM-served areas.
The financial impact is clear. The mechanics are not.
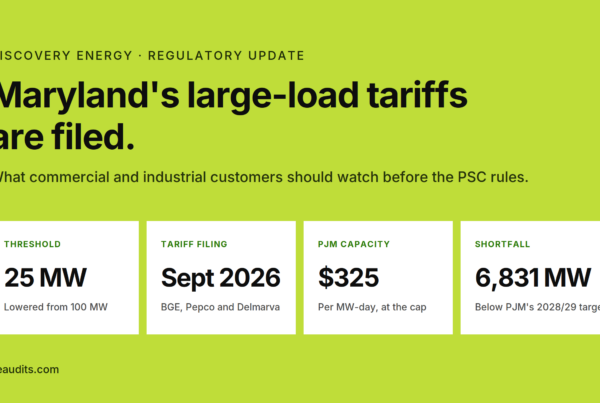
PJM’s 2026/2027 Base Residual Auction cleared at $329.17 per MW-day, approximately 22% above the prior delivery year and roughly 1,038% above the $28.92 per MW-day clearing price for 2024/2025. The 2028/2029 auction then cleared at the FERC-approved cap of $325 per MW-day UCAP for a third consecutive auction.
PJM procured 138,318 MW for 2028/2029 and still fell 6,831 MW short of its reliability requirement.
The result is reaching industrial customers through supply contracts, utility tariffs, capacity tags, transmission charges, and related billing determinants. For many commercial and industrial customers in Pennsylvania, Ohio, New Jersey, and Illinois, the capacity increase is contributing to overall electricity bill increases of approximately 10% to 20%, depending on the facility’s location, rate class, load profile, and contract structure.
The first response should not be a rushed supplier change.
It should be a utility audit.
It is nearly impossible to fix what you do not understand. Auditing utility bills will reduce the pain and provide the information needed to navigate these changing and treacherous times successfully.
PJM Capacity Has Become the Industrial Cost Story
Electricity bills contain several different cost categories. The energy charge pays for the electricity consumed. Delivery charges pay for the local distribution system. Transmission charges support the movement of electricity across the grid. Ancillary charges support grid reliability and balancing.
Capacity is different.
Capacity pays for availability, not consumption
PJM capacity is a payment for the grid’s ability to serve expected peak demand. It compensates eligible generators and demand-response resources for being available when the system needs them.
A facility can use less electricity overall and still face a higher capacity charge if its contribution to the PJM peak remains high or if the capacity rate increases sharply.
The basic financial relationship is:
Capacity obligation × capacity price × delivery days = capacity cost
For example, a facility with a 10 MW capacity obligation facing a $329.17/MW-day charge would have an illustrative annual capacity cost of approximately:
10 MW × $329.17 × 365 days = $1.2 million
That is not a complete retail bill calculation. Actual charges may be expressed in kW-day, adjusted by supplier contract terms, allocated through a utility tariff, or calculated using a facility’s capacity tag and other billing determinants.
The formula does show the core problem. When the capacity price changes from $28.92 to more than $329/MW-day, the multiplier changes dramatically even if the facility’s physical operations remain the same.
Why PJM Capacity Prices Spiked
This is not one variable moving in isolation. PJM’s recent auctions reflect a tighter relationship between available supply, forecast demand, market rules, and the time required to build or connect new resources.
Thermal generation retirements reduced available supply
Coal and other thermal resources have retired across the PJM region. Some retirements are driven by age, economics, environmental compliance costs, or broader corporate decisions. The relevant financial issue is straightforward: retiring capacity reduces the supply available to meet future peak demand.
Replacement generation has not entered the market at the same pace.
Data centers increased load forecasts
Data centers and other large loads are changing PJM’s demand outlook. Monitoring Analytics data, as reported by Utility Dive, attributed approximately $6.3 billion, or 38%, of the $16.4 billion 2028/2029 capacity auction value to data center load.
The number does not mean every industrial customer is directly paying for a data center. It does mean that large-load growth is influencing the amount of capacity PJM must procure and the market conditions under which it procures it.
Interconnection and permitting remain constraints
New generation takes time. Interconnection studies, transmission upgrades, equipment procurement, permitting, financing, construction, and commercial operation do not occur on the same timeline as load growth.
PJM’s official 2028/2029 Base Residual Auction report shows that the auction cleared 138,317.8 MW of unforced capacity while total committed capacity remained below the regional reliability requirement.
The auction outcome is a market signal. It is not a guarantee that new supply will be built quickly enough to remove the pressure.
Market design is now part of the cost discussion
PJM has used price caps and other market mechanisms to limit extreme clearing prices. The official 2028/2029 report includes a no-cap simulation in which the estimated RTO clearing price would have been approximately $554.72/MW-day, with a higher estimated price in the ComEd load zone.
The cap reduced the immediate clearing price. It did not eliminate the underlying supply-demand problem.
Relief may ultimately require federal or regional market-design changes, such as separate treatment for large loads, revised price collars, reliability backstop reforms, or changes to how new load is incorporated into forecasts.
Those changes are important. They are not immediate facility-level solutions.
A backstop procurement is now underway
PJM is not waiting for broader reform to address the 2028/2029 shortfall. On July 31, 2026, it filed a one-time Reliability Backstop Procurement at FERC (Docket ER26-3380-000). Subject to FERC action, PJM plans to accept offers from September 30 through October 21, 2026, target new capacity equal to the auction shortfall, and finalize commitments of up to 15 years in early December. PJM will allocate the cost among load-serving entities in the zones where forecast load growth is driving the need. Utilities, suppliers, and state regulators will then decide how that cost reaches individual rate classes.
For commercial and industrial customers, that creates a new cost that may arrive through supplier pass-throughs or default-service rates, and a state-level decision about who carries it. Several PJM states are making that decision now.
The PJM Headline Price Is Not Your Facility’s Bill
A regional auction price is an input. It is not the final cost paid by every facility.
Two plants in the same state can receive materially different electricity bills because they operate under different utilities, rate classes, load zones, demand profiles, contracts, and tariffs.
The variables that determine delivered cost
A facility’s actual capacity exposure depends on:
- Load zone: PJM includes multiple locational areas, including COMED, ATSI, DEOK, DOM, PPL, BGE, PEPCO, and others.
- Capacity obligation: The facility’s obligation is linked to its contribution to PJM peak demand and the applicable allocation methodology.
- Load shape: A facility with a concentrated peak may face greater exposure than a facility with a flatter profile, even if annual consumption is similar.
- Rate class: Industrial, commercial, primary-service, secondary-service, and other classifications can change how charges are applied.
- Contract structure: Capacity may be separately passed through, embedded in a fixed product, hedged through a bilateral arrangement, or treated differently under a customized supply agreement.
- Utility tariff design: Transmission, ancillary, distribution, demand, and other riders can materially change the delivered bill.
- Metering and billing determinants: Meter multipliers, demand intervals, peak calculations, and account configurations can affect the charge applied.
This is why a regional average cannot substitute for a facility-level review.
Capacity is usually not avoided by changing suppliers
Capacity costs are generally non-bypassable for retail customers. Changing from one competitive electricity supplier to another does not automatically remove the PJM capacity obligation.
The critical exception is contract structure.
A customer may have a fixed-rate contract that specifically hedges capacity charges. Other contracts may fix the energy component while passing capacity, transmission, ancillary services, or other non-energy components through at actual cost.
The word “fixed” is not enough.
A contract can advertise a fixed energy rate while leaving capacity exposure variable. Finance and procurement teams need to review the cost-component language, not just the headline cents-per-kWh figure.
A Utility Audit Is the Starting Point
An organization cannot make a sound procurement, budgeting, or operational decision from incomplete bill data.
A utility audit creates the diagnostic layer required to understand the exposure before attempting to reduce it.
Discovery Energy conducts utility regulatory audits on a contingency basis. We review historical electricity and natural gas bills, tariff application, rate classification, metering, riders, billing practices, and available incentives. If no savings or refund opportunity is found, there is no audit fee.
The goal is not simply to find an error.
The goal is to establish a verified financial baseline.
What the audit should verify
Rate classification
A facility may be billed under the wrong rate class for years. The error may result from an operational change, an incorrect utility setup, an acquisition, or a classification decision that was never revisited.
The audit should verify whether each account is receiving the rate treatment appropriate for its voltage, service characteristics, demand, usage, and operating profile.
Capacity pass-through versus fixed capacity
The supply contract should be examined line by line. The review should answer:
- Is PJM capacity listed as a separate variable charge?
- Is the supplier passing through the actual auction price?
- Is the capacity component fixed for the full contract term?
- Is the fixed price a true hedge or only a fixed energy component?
- Are capacity-related changes permitted at renewal, on a delivery-year reset, or under another adjustment clause?
- Does the contract address capacity tags, PLCs, RPM charges, or PJM auction exposure?
This is one of the most consequential questions facing PJM customers today.
Transmission and ancillary riders
Capacity is receiving most of the attention, but it is not the only volatile component. Transmission charges, ancillary services, congestion-related items, distribution riders, and other tariff-based adjustments can add substantial cost.
A utility audit should determine whether each rider is:
- Allowed under the applicable tariff.
- Applied to the correct account and rate class.
- Calculated using the correct billing determinant.
- Consistent with the supply contract.
- Duplicated or improperly passed through.
Demand ratchets and peak-load contributions
Many industrial bills contain demand ratchets or minimum-demand provisions. A facility may continue paying for a prior peak long after its operating profile has changed.
The audit should compare:
- Current demand.
- Historical peak demand.
- Contract demand.
- Ratchet demand.
- PJM peak-load contribution calculations.
- Facility operating schedules.
- Interval data and peak events.
This analysis can identify whether operational changes, load management, or demand-response strategies have a realistic financial benefit.
Meter multipliers and billing determinants
A meter multiplier error can materially distort a bill. So can an incorrect demand interval, service voltage designation, transformer ownership assumption, or account configuration.
The audit should validate the data that converts measured usage into billed charges. A rate can be correct while the underlying quantity is wrong.
Missed incentives, exemptions, and refunds
Industrial and commercial customers may qualify for exemptions, economic development programs, special rate provisions, or other tariff benefits. These opportunities vary by jurisdiction and utility.
Discovery’s audit process also examines historical billing periods for recoverable overcharges. Depending on the utility and state, the allowable look-back period may range from one to five years or more in certain circumstances.
The audit improves every decision that follows
A verified audit does not replace procurement. It makes procurement more accurate.
It does not replace load forecasting. It gives the forecast cleaner inputs.
It does not guarantee that a supplier will offer a lower price. It clarifies which price components are being compared.
It also creates a defensible baseline for finance, operations, and executive reporting.
What States Can Change and What They Cannot
PJM operates across multiple states and the District of Columbia. State regulators oversee utilities, distribution tariffs, transmission cost allocation in certain proceedings, interconnection processes, and retail customer protections.
State action matters. It does not directly reset the regional capacity clearing price.
What state rate cases can change
State-level proceedings may influence:
- Distribution rates.
- Transmission cost allocation.
- Interconnection cost responsibility.
- Customer-class allocation.
- Utility procurement practices.
- Demand-response programs.
- Large-load tariffs.
- Reliability investments.
- Rate design and rider recovery.
These decisions can change how costs are assigned among residential, commercial, industrial, and large-load customers.
What state rate cases generally cannot change
A state rate case generally cannot reduce the PJM-wide capacity auction clearing price. That price is established through the regional market construct and subject to federal oversight.
A Pennsylvania proceeding cannot simply erase the PJM capacity obligation for a facility in Pennsylvania. An Illinois utility case cannot independently reset the regional auction outcome for all PJM customers.
That distinction is central to our state-level briefings:
The state matters because the utility tariff, load zone, rate class, and cost-allocation rules matter. But the first question remains the same in every state:
What exactly is being charged to this facility, and is it being charged correctly?
The Practical PJM Response: Verify First, Then Buy, Wait, or Hedge
The correct response is not to react to every headline. It is to separate the costs a facility can control from the costs it must manage.
-
Audit first
Start a utility audit before changing suppliers, redesigning operations, or approving a new budget.
The audit should establish the facility’s rate classification, capacity exposure, contract treatment, demand calculations, riders, and billing accuracy.
-
Verify the contract before assuming protection
If a contract does not clearly hedge capacity, treat the capacity exposure as variable until proven otherwise.
Do not rely on the words “fixed price” without reviewing the definition of fixed components and pass-through provisions.
-
Separate capacity from energy procurement
Do not assume a lower energy price will offset an uncontrolled capacity charge.
Energy procurement and capacity exposure are related but distinct decisions. A competitive RFP can improve supplier pricing, but it cannot automatically eliminate a non-bypassable regional obligation.
Discovery manages electricity and natural gas procurement through structured RFPs, apples-to-apples bid comparisons, and market timing. We do not own or develop generation projects, and we have no producer-side conflict in recommending a supply structure.
-
Time procurement around market conditions, not only contract expiration
Contract timing should reflect the forward curve, market risk, delivery-year exposure, and your organization’s risk tolerance, not just the calendar. Once the billing baseline is verified, the contracting decision falls into one of three positions:
-
Buy
Lock a fixed price when budget certainty is worth more than further market flexibility, the offer’s risk-adjusted price is acceptable, and the contract states exactly which components, including capacity, are fixed.
-
Wait
Hold the current position when contract terms allow, the organization can tolerate price movement, and a defined market trigger or decision date is in place.
-
Hedge
Fix a portion of volume or selected cost components when a full fixed position costs too much but unprotected exposure is unacceptable.
Discovery’s monthly Energy Market Reports provide market forecasts, weather analysis, forward pricing, and direct buy/wait guidance. These reports help procurement teams distinguish between an unfavorable short-term headline and a meaningful contracting opportunity.
Capacity exposure itself may reset around PJM delivery years, while energy prices can move every trading day. The two timelines should be managed together but not confused.
-
-
Reduce avoidable peak exposure
Invest in peak-load analysis when the potential capacity savings exceed the operational cost of changing load.
Not every demand-management project will produce a sufficient return. The decision should be based on verified interval data, the facility’s capacity obligation, operational constraints, and the likely persistence of the savings.
-
Create one integrated view across every site
Consolidate bills, contracts, usage, capacity charges, and savings into one controlled dataset.
Discovery’s bill pay and data collection service routes utility bills centrally, supports on-time payment, and logs detailed billing data into TaraBase. TaraBase provides a single integrated view of bills and line-item charges, usage and demand trends, contracts and expiration dates, savings against agreed baselines, site-level and portfolio-level performance, and ESG and energy-intensity metrics.
A multi-site organization should not manage PJM exposure from disconnected spreadsheets and facility-level email threads.
Frequently Asked Questions
What is driving PJM electricity price increases?
The largest immediate driver is the increase in PJM capacity prices. Supply retirements, data center and large-load growth, interconnection constraints, permitting delays, and market-design conditions have tightened the relationship between available capacity and forecast demand.
Energy commodity prices, transmission charges, distribution rates, and ancillary charges can also increase the final bill.
Is PJM capacity included in my fixed electricity contract?
Not necessarily.
Some fixed-rate contracts include a capacity hedge. Others fix only the energy component and pass capacity through separately. A utility bill audit combined with a contract review can identify which structure applies to each account.
Can changing electricity suppliers eliminate PJM capacity charges?
Usually not.
Capacity charges are generally non-bypassable and flow through to retail customers regardless of the energy supplier. A contract may hedge the cost, but changing suppliers does not by itself remove the underlying PJM obligation.
Why can two facilities in the same state have different electricity cost increases?
Facilities may be served by different utilities or load zones. They may also have different rate classes, capacity obligations, load shapes, demand ratchets, meter configurations, contract terms, and rider exposure.
The regional auction price is only one input into the delivered bill.
What does a commercial energy audit examine?
A commercial energy audit can examine consumption, equipment, demand, and operational efficiency. A utility bill audit focuses on whether the utility is billing the account correctly under the applicable tariff and contract structure.
For PJM cost increases, both may be useful. The utility bill audit should come first when the immediate issue is unexplained cost escalation.
How does utility auditing identify billing errors?
Utility auditing compares bills against tariffs, contracts, historical usage, rate classifications, meter data, and regulatory requirements. It may identify incorrect rate classes, duplicate charges, inaccurate meter multipliers, improper riders, demand errors, missed incentives, and recoverable overpayments.
Discovery finds audit savings in 92% of clients audited, based on company data.
What is the role of utility expense management software?
Utility expense management software can centralize bills, payments, usage, contracts, and reporting. Its value depends on data quality.
A platform such as TaraBase is most effective when the underlying utility data has been collected, normalized, verified, and connected to the applicable contracts and tariffs. Software organizes the information. Utility auditing determines whether the information and charges are correct.
How should industrial energy management teams respond now?
Start with a utility bill audit. Then verify capacity treatment in every supply contract, review demand and peak-load calculations, assess transmission and ancillary riders, and consolidate the portfolio into a single integrated view.
Only after those steps should the organization decide whether to buy, wait, hedge, modify operations, or pursue a tariff correction.
Can Discovery Energy manage the full process?
Yes. Discovery Energy provides contingency-based utility auditing, electricity and natural gas procurement, bill pay and data collection, utility data management through TaraBase, monthly Energy Market Reports, reporting, renewables guidance, and energy cost reduction services.
The objective is measurable, documented financial control, not a checkbox solution.
How do we begin a utility bill audit?
Discovery typically needs historical utility bills, account details, service addresses, and relevant electricity supply contracts. We can work from digital bills or coordinate utility access through a Letter of Authorization.
Sources
- PJM, 2028/2029 Base Residual Auction Report (July 14, 2026)
- PJM, 2026/2027 Base Residual Auction Report (July 2025)
- Utility Dive, PJM capacity prices set another record with 22% jump (July 2025)
- NJBPU, An Investigation of PJM’s Capacity Market (August 2026)
- Utility Dive, Data centers drove $6.3B in PJM capacity auction costs: market monitor
- PJM Inside Lines, PJM Board Directs Action on Resource Adequacy, Affordability and Large Loads
- PJM, Reliability Backstop Procurement filing, FERC Docket ER26-3380-000 (July 31, 2026)
- Discovery Energy: Utility Bill Audits; Energy Procurement; Bill Pay and Data Collection; Reporting and TaraBase; Energy Market Reports
Establish a Verified Billing Baseline
Learn more about utility bill audits, review documented results in our case studies, or contact Discovery Energy to discuss a multi-site review.